A spectrum analysis is a compilation of all frequencies and the power levels associated with each over some specified interval.
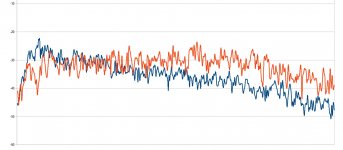
This is a spectrum analysis of two signals.
Both signals (red and blue) are about 0.35 seconds long.
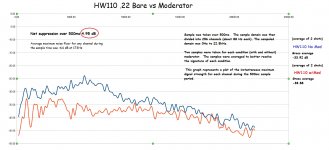
This graph shows a comparative spectrum analysis of the samples.
It shows frequencies between 0Hz and 22kHz in 512 bins with each bin representing a channel 43 Hz wide.
The two signals are over laid.
The blue signal analysis is for the bare rifle.
The red signal analysis is for the rifle with the moderator. The moderator used generally tests as about 10 dB below the bare rifle if you are checking with a cellphone microphone from a distance of about 15 feet. The cell phone microphone favors the low end of the spectrum. It also sounds very good and flat to the average listener.

This very clearly shows what is happening with this moderator (or pretty much any moderator). The moderator captures the low frequency energy passing through the moderator and translates it to higher frequencies. It emits that energy at the higher frequencies. Those frequencies are mostly above about 6 or 8 kHz. The higher the better. The longer this takes the better.
So the moderator should take a blast of high pressure air which contains some set of frequencies and slow that air down so that the signal takes longer to pass (removes the crack) while at the same time translating those low frequencies to higher ones.
That is what it has to do.
EDIT: I want to make clear that the graph represents the PEAK power level for each "bin" during the sample period. IOW the graph does not start at 0 seconds and progress forward. That's not how this works. If you pick any point on the graph, that point is the PEAK power level for the frequencies (the bin) represented during the sample time.
This is a spectrum analysis of two signals.
Both signals (red and blue) are about 0.35 seconds long.
This graph shows a comparative spectrum analysis of the samples.
It shows frequencies between 0Hz and 22kHz in 512 bins with each bin representing a channel 43 Hz wide.
The two signals are over laid.
The blue signal analysis is for the bare rifle.
The red signal analysis is for the rifle with the moderator. The moderator used generally tests as about 10 dB below the bare rifle if you are checking with a cellphone microphone from a distance of about 15 feet. The cell phone microphone favors the low end of the spectrum. It also sounds very good and flat to the average listener.

This very clearly shows what is happening with this moderator (or pretty much any moderator). The moderator captures the low frequency energy passing through the moderator and translates it to higher frequencies. It emits that energy at the higher frequencies. Those frequencies are mostly above about 6 or 8 kHz. The higher the better. The longer this takes the better.
So the moderator should take a blast of high pressure air which contains some set of frequencies and slow that air down so that the signal takes longer to pass (removes the crack) while at the same time translating those low frequencies to higher ones.
That is what it has to do.
EDIT: I want to make clear that the graph represents the PEAK power level for each "bin" during the sample period. IOW the graph does not start at 0 seconds and progress forward. That's not how this works. If you pick any point on the graph, that point is the PEAK power level for the frequencies (the bin) represented during the sample time.
Last edited:
